Published: December 15, 2021
If you’re part of a digital marketing team, you’ve likely been asked the question, “How did the campaign perform?” This vague question can lead to a vague answer, which is the last thing you want to provide, especially when you can use social media data to show that your content performed well and as part of a long-term social media strategy.
Of all of the content channels, social media offers one of the largest selections of resources for reporting, from social media management tools to social media analytics tools. But before you even think about digging into the data for your social networks, you need to know why you need the data.
“Before you even think about digging into data across your social networks, you need to know why you need the data.”
Emily Hoppe, Content Marketing Manager
Why are you making a social media report?
You can easily answer this question if your social media efforts are part of an overall social media or content strategy. Begin by evaluating the goals you created and boiling them down to the core purpose. Perhaps your goal is to increase sales over last year, or to grow your online presence and community. Once you know your goal, you know why you’re making a report and what it should focus on.
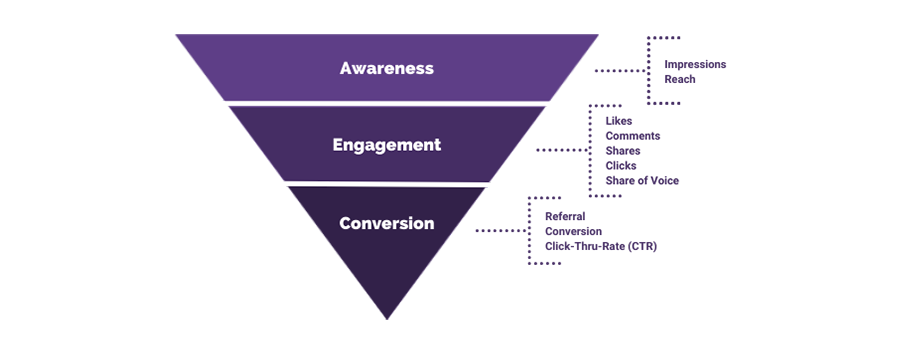
One way to think of your goal is to align it to the stage in the customer journey where you want to make an impact—awareness, conversion and engagement. Each stage in the customer journey aligns with different metrics, and these metrics tell you how much you’ve moved towards your goals.
What metrics are you including in your social media report?
Once you know your goals and where they tie into the customer journey, you can zone in on the metrics that mean the most to you and your stakeholders. Below are several foundational social media metrics that you should keep top of mind as you evaluate your social performance.
Awareness Metrics
Metrics that gauge general interest—or awareness—include reach and impressions. They tell you how many actual or potential views a post or ad received, and give you a high-level understanding of how much your message resonated with your audience. These will also give you a benchmark of what to expect for general social media performance and your level of brand awareness.
Engagement Metrics
Metrics that show you how much action your page received (think reactions, shares, comments and clicks) provide a glimpse into how engaging your content is. You can even go a step further by measuring engagement rate, which will provide more context to how your content performs compared to other types of content.
Engagement metrics also provide another key insight—overall sentiment. Is your audience excited about the types of content you’re sharing (likes, positive comments) or are they frustrated with your message (negative reactions or comments)? Keep a close eye on post engagement by responding quickly to keep your audience engaged and happy!
There’s another way to tell how engaged your audience is, but it’s not as easy to find. Share of voice tells you how many consumers are talking about your brand vs. your competitors. However, these conversations may happen away from your visible channels, such as on forums and reviews sites. Because of this, It’s important to implement a social media listening tool to remain aware of side conversations.
Conversion Metrics
Considered as the most important stage of the customer journey, conversion metrics tell the story of how your audience takes the leap from consumer to customer. These “leaps” are typically seen when a consumer lands on your site or purchases a good or service, and are measured through referrals, click-through-rates, and conversions.
Click-through-rates are a very valuable metric for knowing how well your copy, images and content perform compared to other content, especially if you are A/B testing. If you’re wondering what a good click-through-rate is, it depends on a few factors, including your industry, social media platforms, time frames and more. Visit this resource for an overview of click-through-rates by industry.

Is that all you need to know to build a social media report the right way?
Make sure you know how to use the social media reporting tools you automatically have—Facebook insights, Instagram analytics and Twitter analytics—but don’t miss out on all-in-one tools that can make measuring marketing campaigns a breeze. There are countless resources that provide you with a social media report template, which is great if you’re just starting out.
There is a lot more detail we can go into, but this simple framework for thinking about how you report on social media will ensure that your reporting focuses on what you and your audience need to know, rather than what you don’t. If you’re looking for more information, watch the recorded presentation below for an in-depth overview of how to make sure you’re reporting with the correct metrics and what tools we recommend.
How to Measure Social Media the Right Way [Video]
Need help making the most of your social media? We can help. Give us a call or fill out our contact form and let’s chat!
By Emily Hoppe, Content Marketing Manager